

The BCG matrix, also known as the Boston Consulting Group matrix, is a tool used in business strategy to analyze a company’s portfolio of products or services. The matrix is named after the Boston Consulting Group, a management consulting firm that developed the tool in the 1970s.
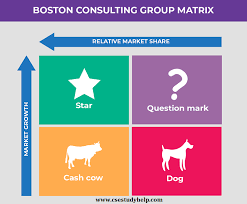
The BCG matrix consists of four quadrants, which are based on two dimensions: market growth rate and relative market share.
The market growth rate represents the rate at which the market for a particular product or service is growing, while the relative market share represents the company’s market share in that product or service compared to its competitors.
There are 2 key variables for the BCG matrix:
- The relative market share(how much of the market your product is controlling). It is plotted on the X-axis. It is not just a market share, but a relative market share.
- Market Growth: this refers to how quickly the market for the product is growing. This is plotted on the Y-axis.
Essentially, based on the plotting on the X and Y axes, you are going to have four (4) categories that make up the BCS matrix.
BCG Matrix Analysis
The four quadrants of the BCG matrix are:
Stars
Products or services with a high market share in a high-growth market. These products or services require a lot of investment to maintain their market position and continue to grow.
Some of its features include:
- High market share
- High market Growth
- Lots of opportunity
- Lots of potentials
- Lots of competitors potentially
It is a product that has a high relative market share. It is also important to note that this kind of product will receive a significant amount of investment because it has lots of potentials.
Cash cows
Products or services with a high market share in a low-growth market. These products or services generate a lot of cash for the company and require less investment to maintain their position.
The cashcow is making a lot of money but doesn’t have a purpose. It has a high market share, but the growth rate is low. The product cannot be said to have a lot of potential and future possibilities as it has almost reached or fully reached its peak.
The idea now is to take some of the money from the cashcow and put it in other categories e.g the star.
It is nice for an organization to have several cashcow products because they can help to sustain the cash flow and to keep the organization running and profitable while it invests in the upcoming ones that will become the new cashcows at some point.
Question marks
Products or services with a low market share in a high-growth market. These products or services have the potential to become stars with the right investment, but require careful consideration before investing resources.
These are some of its features:
- This category is saying ” nobody knows for sure”
- The product may or may not kick off at the end of the day
- Market growth is high but the market share is low
- There is potential
Dogs
The products in this category have a low relative market share and low market growth. They also don’t seem to have so much potential. Products or services with a low market share in a low-growth market. These products or services generate little cash and are not likely to become profitable in the future.
Conclusion
In conclusion, the BCG matrix can help companies to make strategic decisions about their business portfolio, such as which businesses to invest in, which to divest, and how to allocate resources. However, it should be used in conjunction with other strategic tools and should not be the only factor in decision-making.
You can find more info about this on Twim Institute’s BCS training program here or send a WhatsApp message to +2349033279205.